Data Jobs: What does a Data Analyst Do?

Data Analysts get a bad wrap. With the advent of the Data Scientist, Data Analysts are often viewed as Data Scientists lite, however I feel that is not the honest case. Truth is, there is a lot of overlap between the two fields. I will dive deeper into what a Data Scientist is in a future article, but just know my opinion is the definition of Data Scientist as a job is still a bit fuzzy and I think the job title may eventually be broken into a few different titles to better define the differences.

Data Analyst

So what does a Data Analyst do?

A lot actually. You could put 10 data analysts into a room and you would get ten different answers to this question. So the best I can do here is make sweeping generalities. As the old saying goes “Your results may vary”

In general, data analysts perform statistical analysis, create reporting, run ad-hoc queries from data warehouses, create data visualizations, create and maintain dashboards, perform data mining, and create machine learning models (yes, ML is not only for data scientists). Their assignments are business driven. A data analysts is either embedded with a business unit (financial planning, fraud, risk management, cyber security, etc.) or working in a centralized reporting/analytics team. They use their skills to provide reporting and analytics for the business.

Tools used by Data Analysts

  • SQL – MySql, SQL Server, Oracle, Teradata, Postgres – whether simply querying a data warehouse or creating and managing a local data mart, data analysts need to be advanced SQL programmers
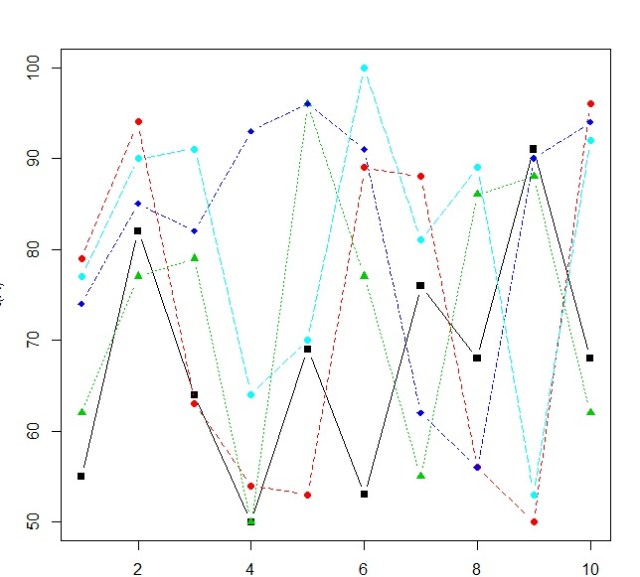
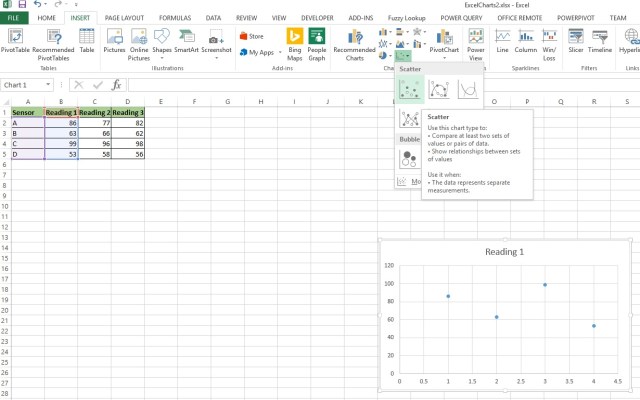
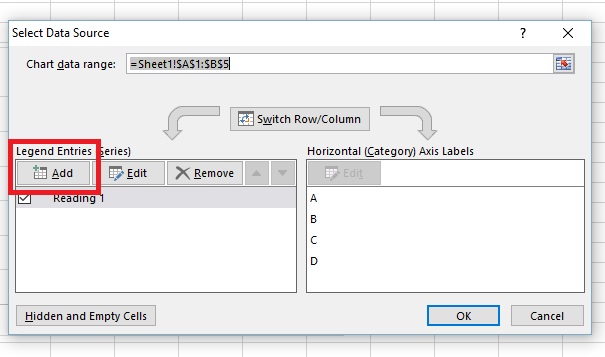
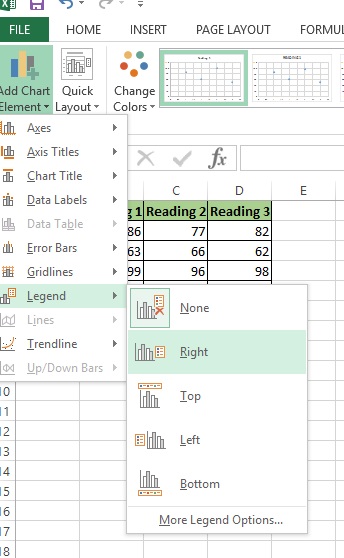
  • Visualization tools – Tableau, Qlik, Power BI, Excel, analysts use these tools to create visualizations and dashboards
  • Python/R – Data analysts should be familiar with languages like Python or R to help manage data and perform statistical analysis or build machine learning models
  • Spreadsheets – Excel, Google Sheets, Smart Sheets are used to create reports, and pivot tables used to analyze the data
  • ETL tools – SSIS, Alteryx, Talend, Knime, these tools are design to move data to and from databases, CSV files, and spreadsheets. Until the data is in a usable format, analysis cannot be performed.

Educational Requirements

Typically a data analyst position will ask for a bachelors degrees, preferably in computer science, statistics, database management or even business. While the barrier to entry for a data analyst job is generally not as high as a data scientist, that does not mean you cannot make a meaningful and well paid career as a data analyst. Also, the demand for data professionals seems to keep going up and up and it most likely will for the foreseeable future.

Python: Create a QR code with pyqrcode

We are using a module that does not come with the Anaconda distribution. To get this code, open up your Anaconda Prompt and type the following code:

> pip install pyqrcode

Next, you will import pyqrcode into python. Also, since the output of this program will be a png picture file, I am running pwd to determine where on my machine the file will be saved.

Next pick a URL you want your QRCode to go to. I chose my website. I assigned my website address to a variable url.

Then, using the pyqrcode module and its method create(), place your variable in the parenthesis ().

Note printing the QR code you created will not display it, but it will give you the basic information on it. To turn it into a QR code, we will need to covert it to a png.

*Note: Some of you may need to download the png module if you get an error. Just go to pip install png and add import png to the top of the script.

Otherwise, just give you file a name, and scale — the larger the scale, the larger your QR code will be.

Finally, go to your directory where the file was saved and open it.

Scanning the QR Code below should take you to my website’s main page.

How do I get a job in Data Science?

This has to be the most common question on data science I am asked, and honestly it is a hard one to answer. For everyone out there trying to get your foot in the door on your first data job, believe me, I feel for you. Multiple interviews without any offers, or even not getting any interviews at all can be beyond frustrating. Now unfortunately, I do not have any magic trick to get your into the data field, but I can share how I did it.

So, how did I get into the data science field…

Honestly, I “Made” my first job. My first career out of the Army was as a biomedical equipment technician. I fixed medical equipment like patient monitors, ultrasounds, and x-ray machines.

We had a ticketing system called MediMizer where all the repairs and routine maintenance jobs were recorded. My bosses would run monthly reports out the system. I read some of the reports and just felt like we could do better.

I started with just Excel. I downloaded some data, created some pivot charts and made some basic visualizations. I asked new questions from the data. I looked at angles that weren’t covered in the existing reporting.

I showed these to my bosses, my co-workers, other department managers, basically anyone who would listen to me. Then I learned about Tableau, and using its free version I was able to create some more professional looking visualizations.

I learned how to make a dashboard, I started analyzing data sets from other departments, and I began feeding them my reports. I went back to school to get a degree and used what I was learning in school to improve my reporting skills.

While my job title didn’t change, I was now able to put data analysis skills on my resume. I was lucky enough to have very supportive management who saw the value in what I was doing, and allowed me to dedicate some of my time to it.

But most importantly, I was now a data professional (even if not in title). I was using data to solve real world problems. I put together a portfolio of some of the reporting I was doing. This allowed me to show my future employer that not only was I able to create reporting, but more importantly I was able to identify real world business problems and use data to help solve them.

The take away is don’t let your job title hold you back. Look around, what kind of problems do you see? Can you find a data-driven solution to help fix the problem? If you do this, you are a now a data professional (even if not in title). A portfolio made from real world examples can be more impressive than generic tutorial or Kaggle projects.

Remember, when trying to break into a new field, sometimes you need to make your own luck.

Python: Create a Word Cloud

Word Clouds are a simple way of visualizing word frequency in a corpus of text. Word Clouds typically work by displaying frequently used words in a text corpus, with the most frequent words appearing in larger text.

Here is the data file I will be using in this example if you want to follow along:

As far as libraries go, you will need pandas, matplotlib, os, and wordcloud. If you are using the Anaconda python distribution you should have all the libraries but wordcloud. You can install it using PIP or Conda install.

Lets start by loading the data

import pandas as pd
import matplotlib.pyplot as plt
from wordcloud import WordCloud
import os

#Set working directory
os.chdir('C:\\Users\\blars\\Documents')

#Import CSV
df = pd.read_csv("movies.csv")

#First look at the Data
df.head()

** Note: if you are using Jupyter notebooks to run this, add %matplotlib inline to the end of the import matplotlib line, otherwise you will not be able to see the word cloud

import matplotlib.pyplot as plt %matplotlib inline

We can use df.info() to look a little closer at the data

We have to decide what column we want to build our word cloud from. In this example I will be using the title column, but feel free to use any text column you would like.

Let look at the title column

As you can see, we have 20 movie titles in our data set. Next thing we have to do is merge these 20 rows into one large string

corpus = " ".join(tl for tl in df.title)

The code above is basically a one line for loop. For every Row in the Column df.title, join it with the next row, separating by a space ” “

Now build the word cloud

wordcloud = WordCloud(width=640, height=480, max_words=20).generate(corpus)

You can change the width and height, number of words that will appear. Play around with the numbers, see how it changes your output

Finally, let’s chart it, so we can see the cloud

plt.imshow(wordcloud,interpolation="bilinear")
plt.axis("off")
plt.show()

interpolation = “bilinear” is what lets the words so sideways and up and down

plt.axis(“off”) gets rid or axis markers (see below)

You can also go back to the word cloud and change the background color
wordcloud = WordCloud(width=640, height=480, background_color = 'white', max_words=25).generate(corpus)
plt.imshow(wordcloud,interpolation="bilinear")
plt.axis("off")
plt.show()

Python: An Interesting Problem with Pandas

I was writing a little tongue and cheek article for LinkedIn on fraud detection using frequency distributions (you can read the article here: LinkedIn). While this was a non-technical article, I wanted to use some histograms from a real data set, so I uploaded a spread sheet into Python and went to work.

While working with the data I ran into an interesting problem that had me chasing my tail for about 10 minutes before I figured it out. It is a fun little problem involving Series and Dataframes.

As always, you can upload the data set here: FraudCheck1

Upload the data.

import pandas as pd
df = pd.read_excel
("C:\\Users\\Benjamin\\OneDrive\\Documents\\article\\python\\FraudCheck1.xlsx")
df.head()

pandasProb.jpg

The data is pretty simple here. We are concerned with our answer column and the CreatedBy (which is the employee ID).  What I am trying to do is see if the “answer”  (a reading from an electric meter) are really random or if they have been contrived by someone trying to fake the data.

First, I want to get the readings for all the employees, so I used pop() to place the answer column into a separate list.

df1 = df

y = df1.pop("answer")

pandasProb1.jpg

Then, to make my histogram more pleasant looking, I decided to only use the last digit before the decimal. That way I will have 10 bars (0-9). (Remember, this is solely for making charts for an article. So I was not concerned with any more stringent methods of normalization)

What I am doing below is int(199.7%10). Remember % is the modulus – leaves you with the remainder and int converts your float to an integers. So 199.7 is cut to 199. The 199/10 remainder = 9.

a= []
i = 0 
while i < len(y):
     a.append(int(y[i]%10))
     i += 1
a[1:10]

pandasProb2

Then I created my histogram.

%matplotlib inline
from matplotlib import pyplot as plt
plt.hist(a)

pandasProb3.jpg

Now my problem

Now I want graph only the answers from employee 619, so first I filter out all rows but the ones for employee 619.

df2 = df.query('CreatedBy == 619')
y1 =df2.pop("answer")

Then I ran my loop to turn my answers into a single digit.

And I get an error.  Why?

pandasProb4.jpg

Well the answer lies in the datatypes we are working with. Pandas read_excel function creates a Dataframe.

When you pop a column from a dataframe, you end up with a Series. And remember a series is an indexed listing of values.

Let’s look at our Series. Check out the point my line is pointing to below. Notice how my index jumps from 31 to 62. My while loop counts by 1, so after 31, I went looking for y1[32] and it doesn’t exist.

pandasProb5.jpg

Using .tolist() converts our Series to a list and now our while loop works.

pandasProb6.jpg

And now we can build another histogram.

pandasProb7.jpg

The Code

import pandas as pd
df = pd.read_excel
("C:\\Users\\Benjamin\\OneDrive\\Documents\\article\\python\\FraudCheck1.xlsx")
df.head()

df1 = df
y =df1.pop("answer")

a= []
i = 0 
while i < len(y):
   a.append(int(y[i]%10))
   i += 1
a[1:10]

%matplotlib inline
from matplotlib import pyplot as plta1 = []
i = 0
while i < len(y2):
 a1.append(int(y2[i])%10)
 i = i+1
a1[1:10]

plt.hist(a)

df2 = df.query('CreatedBy == 619')
y1 =df2.pop("answer")

y2= y1.tolist()
type(y2)

a1 = []
i = 0
while i < len(y2):
    a1.append(int(y2[i])%10)
    i = i+1
a1[1:10]

plt.hist(a1)


Qlik Sense: A first Impression

So I am trying out Qlik Sense as a possible BI option for work. I have some limited experience (through grad school) working with another one of their products Qlik View. I will say right from the get go, Qlik Sense is much more user friendly.

Opening it up, I get the following splash screen

qlikSense.jpg

Qlik then asks if I would like to Create a New App.qlikSense1.jpg

I click Create A New APP and I get a window to name it.

qlikSense2.jpg

It says New app created, and asks if I want to open my app

qlikSense3.jpg

Now I am brought to a page to add my data. I have two options, one a more GUI driven method, and the other that will allow me to create my data model using Qlik’s script (very similar to SQL).

I am going to go with the GUI method for now.

qlikSense4.jpg

I choose Excel files

qlikSense5

Next I select a file QlikTEst.xlsx that I put together for this test drive.

qlikSense6.jpg

My file appears in preview mode. Notice I am able to select both sheets to load and unselect columns I don’t want.

qlikSens7.jpg

I click Prepare Data at the bottom and I am brought to this screen. Notice the red triangle warning on the bottom of the screen. It says I have possible associations.

qlikSens8.jpg

I click the warning and I now have a recommendation for an association to make between sheets. My Equipmentkey column matches up(53%) on both sheets.

qlikSens9

Just double click the Recommendations box and your pages are now joined

qlikSens11

Now hit Load data

qlikSens12.jpg

Qlik now brings you to a work sheet.

qlikSens13.jpg

I want to create a bar chart, so I drag one in from the menu column.

qlikSens14.jpg

Now I pick my Month as my dimension

qlikSens15.jpg

And I choose WorkOrderNo as my measure

qlikSens16.jpg

Now I choose an Aggregate of Count()

qlikSens17.jpg

And I have a bar chart.

qlikSens18.jpg

Now, let’s add a filter – drag it in from the menu column

qlikSens20

Select FacilityCode as my dimension

qlikSens21.jpg

I can adjust the filter size by clicking on these points

qlikSens22.jpg

Now hit done at the top of the screen

qlikSens23.jpg

And I now have a live interactive bar chart.

qlikSens24.jpg

My Thoughts on Qlik Sense

Qlik Sense is insanely easy to get up an running. You really don’t need to know much more than how to drag and drop. However, if you are like me and enjoy getting under the hood, Qlik does allow you custom code your data models and formulas.

My only complaint, and this could be because I am new and don’t know a work around, is having to hit Done to leave the edit screen before I can test the interactivity of my charts.


R: Graphing with matplot()

matplot() is a R function that you can use to make easy graphs in R.

Let’s start by creating a data set.

We are going to create a 5 x 10 matrix representing 10 quiz and test grades for 5 students

x <- sample(50:100,50, T)
x
# convert to a 5x10 matrix
A <- matrix(x,5,10)
A

matplot

Let’s make name our rows and columns

#name and assignments vectors
names <- c("Sara", "Jill", "Jared", "Kim", "Don")
assignments <- c("Quiz 1", "Quiz 2", "Test 1", "Quiz 3", "Quiz 4", "Midterm", "Quiz 5", "Quiz 6", "Test 2","Final")
#assign labels to columns and rows
row.names(A) <- names
colnames(A) <- assignments
A

matplot1.jpg

Let’s graph it

Start simple

matplot(A)

matplot2.jpg

Note our X axis goes to 5 – we are graphing students against grades.

What if I want to graph assignments against grades? Simple, transpose the matrix

matplot(t(A))

matplot3

Okay, but the numbers are distracting. Let’s do something about that.

matplot(t(A), type="b")

matplot4

I don’t like the numbers

# replace numbers with shapes
matplot(t(A), type="b", pch=15:19)

pch 15:19 lets us rotate through 4 shapes (15 – 19) – try different numbers on your own

matplot5.jpg

I am adding a color element next. You will see the need for this in our next section.

 matplot(t(A), type="b", pch=15:18, col=c(1:5))

This has no current effect on our graph

Legend

Let’s add a legend

legend("bottomleft", inset=0.01, legend=names, col=c(1:5),pch=15:19,
bg= ("white"), horiz=F)

okay, here is the syntax: legend(location, padding, legend data, colors, symbols, background, horizontal vs vertical layout)

This is why I added the color element to our matplot, so the colors in the legend would match up to the colors in my graph.

matplot6.jpg


Excel: Scatter Plots

Download worksheet here: ExcelCharts2

Our data set contains 3 sets of readings for 4 sensors (A,B,C,D)

excelCharts1

Scatter Plot

Reading 1

Highlight Columns A and B – From Ribbon > Insert>Scatter

excelCharts2.jpg

Here is a close up of the Scatter Plot icon

excelCharts3.jpg

Here is our plotting of Reading 1

excelCharts4

Reading 2

To add the Reading 2 column to the plot, right click on the chart area and Select Data

excelCharts5

Select Add

excelCharts6

  • Select the Heading from Column C for Series Name
  • A2:A5 as Series X values
  • C2:C5 as Series Y values

excelCharts7.jpg

Reading 3

Repeat again for Reading 3

excelCharts8

Now, double click on the Y-Axis and go to the Format Axis box that will appear on your right.

Select the Bar Chart Icon, and change the Axis Bounds to minimum of 40 and max of 100.

excelCharts9.jpg

This will help make the spacing between dots more pronounced. Generally altering a Y Axis away from 0 is considered bad taste as it tends to over-pronounce differences between elements.

excelCharts10

Now click on X-Axis and make the changes below.

excelCharts11

Next, go to Add Chart Element in the upper right corner. Legend>Right

excelCharts12

Here is our scatter plot

excelCharts13

Now wait a minute. I know what you are thinking, why is my X Axis 1 – 4 and not A,B,C,D

This is a flaw in Excel. There are some third party packages you can install that will allow you to rename the X Axis in a XY Scatter plot, but not with Excel in its default state.

You can however change the chart type to a Line Chart.

Go to Ribbon > Change Chart Type

Select Line

excelCharts14

Now your X-Axis is properly labeled

excelCharts15.jpg


Python: Line Graph

Let’s build on what we learned in : Python: Intro to Graphs

First, import pyplot from matplotlib

Remember %matplotlib inline let’s you see your graphs in the jupyter notebooks

pythonLine

Line 1

Note I am using a list comprehension to fill the x axis.

pythonLine1

Now, let us do some formatting:

  • ‘r:’    –   red dotted line
  • label = ‘up’   –  adds label to the line
  • py.legend(loc=9)  – adds a legend to the chart

pythonLine2

Line 2

For line 2, I want to create a reverse curve:

  • d = u  – list u is copied to d
  • d.reverse() – reverses values in d

pythonLine3

Plot the line.

  • ‘g-.’ – green dashed line

pythonLine4

Combine the two lines

pythonLine5

Line 3

Here I use another list comprehension  and zip to make our last like. This adds each element of list u and d in order.

  • ‘b-‘ – blue solid line

pythonLine6


If you enjoyed this lesson, click LIKE below, or even better, leave me a COMMENT. 

Follow this link for more Python content: Python

Excel: Intro to Charts

Excel makes building basic charts easy.

Download sample data set here: ExcelCharts1

The Data

Our sample data set here is simple enough. We have 5 sensors (A,B,C,D,E) and one reading from each sensor.

excelChart

Column Chart

Let’s start with a column chart. To create a column chart, first select (highlight) your data set and then go to Insert>Column Chart in the Ribbon Bar.

excelChart1

From the column chart options, I am going to pick the first 2D chart option

excelChart2

excelChart3

Once a chart is created, you will notice a new element – Chart Tools – in the Ribbon Bar.

The first thing I want you to explore is Chart Styles. Click on the different options and see what happens.

excelChart4

Next, let’s try changing the colors:

excelChart5.jpg

Now go to Add Chart Element

Go to Axis Titles>Primary Horizontal

excelChart6

Now click on the Axis Title and rename it.

excelChart7

Label this Axis “Sensors”

excelChart8

Now select Primary Vertical and name it “Readings”

excelChart9

Now to change the chart title. Click on the title:

excelChart10

Rename it “Sensor Readings”

excelChart11


If you enjoyed this lesson, click LIKE below, or even better, leave me a COMMENT. 

Follow this link for more Excel content: Excel