I made these video walkthroughs as an alternative to following the lab in the text book. I know some people (myself included) learn better from watching videos.
This is a walkthrough for Lab 1 for my course on Database Development and Design. Feel free to watch video, but I will not be sharing any files as they were not created by me and I do not have permission to share them.
From access: External Data> New Data Source > From File > Excel
Check First Row Contains Column Headings and click Next
You can change the data types of the column, but I am just leaving them as is.. click next
Let Access add primary key > click next
Name your table and hit finish
Now if you click on the Employee table in the table list on the left you will see the results
Comparison Operators
Comparison operators are the symbols that let us check if something is equal to, greater than, less than, etc
Lets create a query using comparison operators
Click on Create > Query Design
Drag the Employee table into the query workspace
Add all the fields below and in the Criteria spot for Age, put >40
Right click the Query Tab and click Datasheet View
You can now see the results with employees only over the age of 40
Play around with it, try less than 40, >= or <=, just try some different queries
Also remember, you can right click on Query1 tab and select SQL View to see the SQL code that runs the query
You can also use Between to select Criteria- Below will return everyone aged between 30 and 45
Dates
Now lets try querying dates
When working with dates, you need to put #’s before and after the date. If your Access is set to USA settings, we go MM/DD/YYYY, European (and most of the rest of the world) goes DD/MM/YYYY
The below query will return employees hired after Jan 1 2010
When discussing database design, the Model refers to the mock up we create for handling our data. This can be just a simple diagram you draw our or in larger databases, multiple pages of inter-related ERD (Entity – Relationship – Diagrams)
Often times, the model is developed in response to a use case or real world problem. So we are going to look at couple of examples here and see how a model is made to solve a real world problem:
First one, let’s look at a hotel geared towards groups of high school students. They want a way to keep track of which rooms the guests are staying in, as well as what group the guests belong to. They also want to have in the database a way to track which adults are associated with each group
So we create 3 classes, Group, Guest, and Room. Both Room and Group can only exist once. Room 2 is a Room 2, you can’t have 2 Room 2s.
Multiple Guests can be part of a Group though
One quick to identify problem with this model is, what happens if one person from a group leaves early. This model can not handle that exception
Optionality and Cardinality
Optionality and Cardinality are related to how many instances of an item can exist in Class (or table once its in the database)
Optionality is the smallest number of items that can exist. It represented by the first number in the grouping.
Cardinality is based on how many total objects the other side can associate with.
In the case below, A student can enroll in multiple courses and a course can have multiple students into. At the same time, a student could be enrolled in 0 courses, and it is possible to have a instance where there are no students in the school at all – so the Optionality and Cardinality will look like this.
What we have created here, is a many to many relationship. That is due to the fact that both students can be in more than one course and courses can have more than one student.
To get around the problem of many to many relationships, database designers need to implement intermediate classes or (lookup tables). This creates Course and Student classes that will not have duplicates, and an intermediate class that allows you to keep track of all the iterations of student and course combinations
With a Start and End date added to the Roster class, you now have an historical class that can track when a student took a particular class, even solving the issue of what happens if a student has to take the class again, or if the student drops the class.
The entire purpose of related tables is that they allow you to query information from multiple tables at once. In this example we will be creating a query that looks at the Class and Teacher tables we built in the intro to MS Access Lesson: link to lesson
To start, we will select Create from the Menu bar and Query Design from the Ribbon
Next drag the Teacher and Class table over to the blank space for Query1
down below you can select the columns (fields) you want to bring in from the tables.
Next, put all the all the available columns in the Fields below
You’ll notice the Fields all have their table names in front of them in the drop down. This is common SQL notation for <table>.<field>
Right click on the query tab and select datasheet view.
Note the two tables are matched up by the teacherID in two different tables. That is the relationship. That is how relational database allow tables to interact
Lets remove the teacherID from the query
Go back to design view and uncheck the columns to hide them from the query
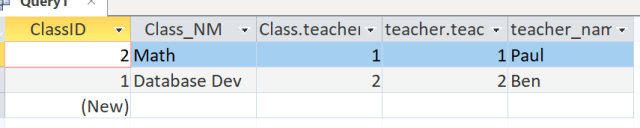
To see the results, click on the Query1 tab and select Datasheet view
So you can see, our query returned information found in 2 different tables
Now, let’s right click on Query1 tab and select SQL View
This is how you would write this query using SQL
Select Class.ClassID, Class.Class_NM, teacher.teacher_name — This means that we want to see these three columns. Note the table name is in front, followed by the column or field name, separated by a ‘.’ This is common practice in SQL. It tells the database which table the field is in. And in situations like the teacherID column that is found in both tables, it clarifies which one you want.
from teacher INNER JOIN Class ON teacher.teacherID= Class.TeacherID; — this is a typical join statement. It says use both teacher and Class tables, and match the records up using the TeacherID field.
So my wife works at a high school and had an issue trying to upload an Excel file to a database. She asked me if I could look at the file and fix any errors.
**Note the names below have been completely made up, these are not real students. I have not and would not share any private information on my site
Okay, so the database she is trying to upload the file too has request the following columns:
ID > Last_Name > First_Name > Grade > Email
**For my non US readers, in the United States we commonly refer to the year you are in school as the grade, so Grade 12 is the final year for high school students.
First thing first, lets split our Student column into first and last name
Let’s make some space, right click grade column and click insert to add a new column
Now, click on student column, select Data from the menu bar, and Text to Columns from the Ribbon bar
Note all the names are different lengths and some students have two last names, while others have a first and middle name. So our best bet is to split this by the delimiter (in this case the comma)
Select comma from the choices, you will see your data preview window what the results will look like
I don’t need to convert data types, so I just ignore this window > Hit Finish
Now all you have to do is change the column names
Next, lets check for bad email addresses. One good thing about email addresses in a single organization is they are often all the same after the @ sign, so we can use the RIGHT() function to count backwards
A quick count of characters (make sure to include the period and @) tells me that starting from the end of the email address, there are 11 characters up to and including the @
So my formula would be =right(E2,11)
With this nice short file, it is easy to see that the forth student has a mistake in his email address.
In the real world, where you have 100’s or even 1000’s of students in a school, it might be easier to use an IF statement to more easily tease out bad emails. Using the code below, we have nested our Right() function inside an IF statement. And we will return 0 for all good emails, 1 for a bad one
=IF(Right(E2,11)=”@school.edu”,0,1)
Even with long lists, the 1 usually jumps off the page against the rows and rows of 0s
Finally, files can some times have spaces before or after data in the cells, and this can mess up an upload to a database sometimes.
We can simply use the Trim function to get rid of extra whitespace.
Run Trim in a new column > Then right click and copy the whole column
Go back to your original column > Paste > Paste Special…>Paste Values (the blue arrow). That will paste just the data trimmed of whitespace, not the formula.
Once you are done, delete the added columns you were working with for the IF() and Trim() statements, make sure your columns are properly named, and you are good to go.
Calculated fields are exactly what they sound like, fields created by a calculation. To make up, let’s open up the Kmeans Table. Go to the Table Fields tab and click on More Fields > Calculated Field > Number
Select AVG Labor and Labor Cost from the Expression Categories. Let’s multiply the two values, put a * in between them
A new field will appear, you can rename the field if you want.
If you look at the table in Design view, you can examine the calculated field another way
The goal of good database design should be to provide a solution to real world problem. In order to create a solution though, you first need to to understand the problem at a granular level.
One approach that I like to take:
Break down tasks users perform
Ensure you have the data needed for those tasks
Keep in mind:
•Understanding a problem involves looking at both the input and output tasks
•The data model goes hand in hand with the use cases
•Continue to re-evaluate whether the data model can handle the input and output use cases
•Most of the time, users won’t have this readily available and it needs to come through discussion
•Users can be very narrowly focused, it’s your job as the designer not to be
Let’s imagine an example of a meal delivery service where people call in to a receptionist who takes the order and dispatches drivers to delivery the meals
We need to figure out:
1.Who are the users?
2.What tasks do they do?
3.What data is needed?
First make sure you understand the process:
Users and Tasks:
•Visitor calls the company
•Receptionist takes the order
•Receptionist selects/assigns a driver
•Receptionist gives order to the driver
•Driver picks up meals
•Driver delivers meals
•Visitor pays the driver
•Driver informs the company
•Receptionist records the completed order
•Driver maintains timesheet
Then decide what tasks our system will be involved with?
Users and Tasks:
•Visitor calls the company (probably not)
•Receptionist takes the order (yes – need to record some details)
•Receptionist selects/assigns a driver (yes – need to see who is available)
•Receptionist gives order to the driver (yes – need to be able to see the order details)
•Driver picks up meals (maybe – do we need to keep track of time of pickup?)
•Driver delivers meals (maybe – do we need to keep track of delivery time?)
•Visitor pays the driver (probably not)
•Driver informs the company (maybe – is the driver entering details himself or calling?)
•Receptionist records the completed order (yes)
•Driver maintains timesheet (yes)
Then we can create some basic tables and relationships based on this imformation above
The Driver and Order interact as the driver needs to get an order to deliver, and the driver and timesheet interact as the driver needs to fill in the time sheet, but the Timesheet and Order do not interact though, so there is no relationship there.
Next, we can fill in some attributes
This basic model above should meet the needs of the use case described
Sample of steps to take when working through the analysis phase:
•What does the user do?
•What data is involved in the user’s jobs?
•What is the main objective of the system?
•What data is needed to satisfy the main objective?
In this lesson, we will be importing an Excel file into MS Access and learning to use the sort and filter functionality. If you want to follow along, download the Excel file below:
I am using the same database I build in the previous lesson. You can start a new one if you want, but since most of these early lessons will be sandboxing( a programming term for playing around with a software platform) in Access it doesn’t really matter if you just use the same database for everything.
From the Home screen in Access, click on the External Data tab and open up the External Data ribbon
Select New Data Source > From File > Excel
Browse for your excel file, select Import the source data into a new table and click ok (note, if you want to use a different Excel file, you can)
My excel file has column names in the first row, so I make sure that is check and I click next
Up top, you can change column names, and data types, but in this case, Access did a good job of assigning datatypes for me. Next>
I check Let Access add primary key, you could just select your own from the drop down though. Next >
Name your table whatever you want and hit Finish
If you spent a lot of time fixing data types and column names or if you are going to upload a file like this on a regular basis, you can save import steps, but I am going to skip this for now, just hit close
Click on your new table to open it up
Sorting
Filters and sorting work like they do in Excel, here I select my column and Sort Largest to Smallest
Filter
Here is select Model and filter down to a single model (Accuvix A30)