MS Access is a all in one database solution provided as part of MS Office. Access was much more popular years ago when more powerful solutions such as Oracle an SQL Server couldn’t be effectively run on desktops. While Access’s time in the sun is definitely in decline, for someone new to concepts of databases, Access can be a great introduction.
Let’s start by creating a simple database. Open up Access and click on Blank Database
Give your blank database a name in the pop up window
By default, you’re new database will start with a Table1 with an ID column. Click the drop-down on the next column space to add a new column. For this example, let us select Short Text as our data type. Short text can handle any text up to 255 characters
After you set the datatype, you can click on the column name and rename it
Let’s add another column, set the datatype to number
Now click the X next to table1 and you will be prompted to name your table
Another way to build a table is through the table design feature
You can name your columns and select data types: Note AutoNumber is an auto incrementing datatype that works to provide you with an auto populating ID number
Access requires primary keys for all tables (something not required, but recommended in other systems like MySQL or SQL Server). To create a Primary Key, right click on ClassID and select Primary Key
Finally, let’s just use SQL to create a table. Select Create an then Query Design from the ribbon menu
Select SQL View
Put in the SQL below
create table teacher (
teacherID int primary key,
teacher_name varchar(255))
Click on the new teacher table in the left and you can fill in some data
Now let’s create a relationship between the Class and Teacher tables. Click on Database Tools > Relationships
Drag the Class and Teacher table into the blank sheet and click Edit Relationships
Click create new, select your tables and columns from the drop down, and select Enforce Referential Integrity and select the Create button
A Relationship line will appear, showing you your connection
When start on the design of a database there are few questions you need to ask right away:
Not to be dismissive, but do not simply build a database to the specs of a request
Take stock of the data at hand, ask around if there is related data that also might be included
Think about what users will be doing with the data
As best you can, try to anticipate other uses for the data that come up
Focus on the type of data you are dealing with, and how it can be best used/store
Don’t only focus on the current use of the data, consider the data may find other uses as well
Now, let’s look at database development through the lens of a software development cycle
Keep in mind, this process is not simply linear. This process, in the real world, goes through many iterations. Change management is good idea to put in place. It helps you to deal with issues like:
New data sources
New requirements from business users
Technology platform changes in your organization
To get started, we need to come up with a problem statement, something that can describe the problem we are trying to solve. Use cases are commonly used when developing problem statements. Use cases help to demonstrate how a user will be interacting with your database:
Transactional – think like a cash register, adding new transactions to database, updating inventor
Reporting base – data doesn’t change often, people want to look more at aggregate numbers over the details of each transaction. (End of the day reporting – what is the final sales total from the cash register)
You can use Unified Modeling Language (UML) to create your use case. UML uses a series of diagramming techniques to help visualize system design. Below, the stick figure represents users and each oval will show one of the tasks the user hopes to be able to use the database for. UML is great for mock-ups, but you should also include a detailed document that provides deeper insight into the tasks below.
Now imagine we want to create a database to store plant data:
Using this data, we can come up with a few basic use cases
Use case 1: Enter (or edit) all the data we have about each plant; that is, plant ID, genus, species, common name, and uses.
Use case 2: Find or report information about a plant (or every plant) and see what it is useful for.
Use case 3: Specify a use and find the appropriate plants (or report for all uses).
How does our existing table design handle our use cases:
1.Can we maintain data? Yes
2.Given a plant can we return the uses? Yes
3.Given a use can we return the plant? Not really
We need to re-examine this data from a class point of view
We are dealing with 2 classes in the Plant data:
1.Plant
2.Use
•One plant can have many uses
•This is an example of a relationship between classes
•Relationships between classes are represented with a line in UML
•We need more details besides just a line to know how classes relate
•The pair of numbers at each end of the line indicates how many objects of one class can be associated with a particular object of the other class
•The first number is the minimum number (0 or 1 to indicate whether there must be a related object)
•The second number is the greatest number of related objects (1 or n to represent many)
Design Phase
•You spend a lot of time in the top 2 quadrants
•It is an iterative process, not simply linear
•Keep reviewing the model to ensure it satisfies the problem
•Once you have a model that works, move on to design
•For the database world, design involves:
Converting our Class Diagram into Database Objects: Tables, Keys, and Relationships
Application Phase
•Now that you have a database foundation in place, the Application phase builds upon it by adding additional functionality for the users
•The Application phase satisfies the Use Cases:
Input Use Cases will most likely be satisfied with Forms
Output Use Cases will most likely be satisfied with Reports
Database = A collection of structured tables designed to store data
Table = A database object that stores data by organizing it into rows and columns
Field = Each column in a database table is called a field
Record = Each row in a database table is called a record
We want to create databases that will:
1.Store our data
2.Let us interact and ask questions of the data
3.Retrieve or export the data
In order to do this, we need to have a properly designed database
Example Situation #1:
A teacher puts out a sign up sheet during back to school night to allow parents to donate various classroom supplies. The parents of the class fill out the sign up sheet and it looks like this:
The next day the teacher types up the donation sheet and puts it in Excel. The teacher decides that he wants to try to build a database to keep track of what each person donated. After noticing that at most someone is donating 3 items he builds a database table that looks like this:
In Excel:
Database:
The teacher is pleased. He set out to create a database to keep track of what each parent donated. Given a parent name he can easily see their donations. However, when he wants to see all the parents that have donated tissues he ran into some problems.
Problems:
•The table answers questions in 1 direction only (given a parent you can easily return donations)
•To answer the question in the other direction (what parents donated tissues?) you need to search across 3 different fields
•The table was designed without recognizing we are dealing with 2 different classes
With a parent name provided as input (ex: Greg Carter), a record in the table can be identified. Once we have identified a record, the values for all fields in that record can be retrieved.
So, this table works to answer questions like this:
“What donations did Greg Carter provide?”
Example Situation #1 Takeaways:
1.Do not let an existing form dictate your table design (a form can be simple like a paper signup sheet or more complex like the interface of an application)
2.You must get to know your data to be able to correctly identify how many classes of data you have
3.Be careful when designing your table to answer a particular question – will you ever want to ask that question in the opposite direction?
4.Don’t rush to simply load given data into a table – take the time to think through design
Repeated Information:
•Another common problem is storing the same piece of information several times
•If you find this happening, you may be placing too much emphasis on an existing form
Example:
A business’s paper order form has customer name, address, phone number. We wouldn’t want to create a database table to keep storing all the information for every single order. It is inefficient and will most likely lead to inconsistencies and future problems.
If you see repeated information in a table, it should be a huge red flag for you to re-examine the design.
Designing for a single report:
•You can’t allow an existing form to determine your table design
•Similarly, you can’t allow a report to determine your table design
•Think about reports as nicely presented data coming out of your database
Data scientist, data architect, data engineer, database administrator, data analyst: all of these jobs have 1 big thing in common – they all work with databases. So what exactly are databases?
A database is a software platform designed to store, manage, and manipulate data. They come in different flavors from small desktop based solutions to large enterprise databases sprawling across 100’s or 1000’s of servers.
Databases are used for all types of business and personal needs. Some common examples are transactional databases > like the ones run on cash registers in a retail store. They track inventory, prices, and sales.
Data warehouses: they are used by data analysts and business intelligence teams to run reports and build dashboards against. Also, there are unstructured databases that hold information like documents, images, audio, and free text.
From a very broad view, databases can be broken down into two categories: structure and unstructured. Another way you may describe it is SQL vs NoSQL. While not all structured databases run SQL, the vast majority do, so for the sake of this article, we will use SQL and unstructured interchangeably.
Structured SQL databases are still king of the data world at the moment. Most companies use them for both day to day functions as well as reporting and advanced analytics. These databases fall under the umbrella of relational databases.
RDBMS = Relational Database Management System
RDBMS databases stores data in one or more tables formatted into rows and columns (think Excel or Google Sheets). These tables are typically set up to handle some specific data, like an HR employee list or a student grade table. The tables can be joined using SQL to create rich datasets.
In the picture above, we have 2 tables. Using the ID from the first table, you can determine who the instructors are for each of the classes in table 2. This is, at the most basic level, a relational database.
Relational databases are normalized, meaning the duplicates are removed and big tables are broken up in to small more specific tables. This is done to save disk space as well as improve performance. I promise, I will have a whole write up dedicated solely to data normalization, but for now, just know it is a property of RDMS.
Other factors of Relation database design include:
ACID – set of rules to guide database design
Atomicity – integrity of an entire database transaction
Ex: if you are updating a person’s first name, the entire value must get updated to be successful (not just the first letter); no view of partial transactions in progress
Consistency – only data that pass validation rules are permitted
Ex: email address requires an @ otherwise it should not be written to the database
Isolation – the ability for a database to process multiple transactions simultaneously
Ex: if you are performing 2 updates, the first must complete before the second
Durability – once data is saved it should remain saved even when the machine shuts down
Ex: if a machine shuts down in the middle of an update, it should be rolled back; if an update is completed and a machine shuts down then the update should exist on the restart
Non-relational databases (NoSQL) are designed to fill in the gaps left by RDMS. These databases scale easily. Their loose approach to storing and managing data allow them to scale across multiple servers, allowing them to grow with demand and shrink as demand shrinks. They have a more flexible design, allowing for storage of data not easily handled by a RDMS such as: images, audio, documents.
When it comes to growth and scaling, there is a clear difference between the two approaches
The following articles will be based on RDMS, mostly due to the fact they are still the primary database in use today, and also they are easier to conceptualize. Don’t worry though, everything you learn here will help you to later understand the world of NoSQL unstructured data.
One of the best ways to use a tool like Excel is to build out a project. In this example I will be using Excel to build a simple grade book for tracking grades in a class. I’ll be using some simple formulas and doing a bit of formatting to make it look good.
Let’s start by creating a list of assignments. For this class we will have 4 Homework Assignments, 3 Quizzes and 2 Exams:
Next, let’s get some students:
Now let’s get some grades. You can input them all manually or we can use the randbetween() function to fill them in.
For Homework, lets imagine each assignment is worth 20 points. So we can run the formula =randbetween(0,20) and drag it across to fill all the HW cells:
Now, left like this, the cells will constantly update with new random numbers. If you don’t want that > copy the cells> paste values
Let’s repeat this process for Quizzes and Tests. Make Quizzes worth 50 point, and Exams worth 100
Now lets calculate the grades:
For Homework, the formula will be simple, add up the 4 grades, divide by total point possible (80). This will give you the percentage in decimal form.
To make this more readable, let’s add a new column call HW_Total
Repeat for Quizzes and Exams (remembers quizzes are out of 50 points, and Exams are 100 points)
We can reduce the number of decimals showing by using the ribbon bar.
Now, before we create a final grade, lets use Range Naming to make this part easier – if you are not familiar with Named Ranges: Click Here for Lesson
Let’s name HW_Totals HW, Quiz_Total > QZ, Exam_Total > EX
Now, here is where it gets tricky. We want homework grades to be worth 20% of the final grade, quizzes worth 30% and exams worth 50%.
Using named ranges we created we can use the following equation: =HW*.2+QZ*.3+EX*.5
Note once you hit enter, it fills in the grades for all the students
If we want to make this a percentage, we can highlight the grade and click the percentage symbol
Okay, so we have a working grade book, but it isn’t pretty. Lets start by highlighting all the assignment titles, then bolding the text. We can also add some borders
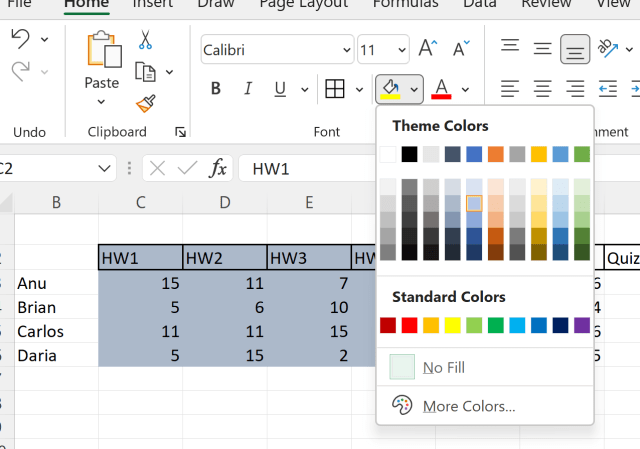
Let’s separate the sections with background colors
Have fun, try different colors for each section, play with the borders
This is a simple project, but it utilizes many of the skills you will use repeatedly when working with Excel. I look forward to making more advance Excel project tutorials in the future.
While generalizing any profession is difficult since so many factors can come into play: (academic versus corporate — large company versus start-up), I find the role of Data Scientist can truly only be described by breaking it apart into three very different roles. For lack of better terms I will name these roles: Academic/Research Data Scientist, Applied Data Scientist, and finally Data Analyst/Scientist. These roles require different skill sets and different mindset that I will discuss below.
First off, I would like to put my bias out front, I am an Applied Data Scientist. Now, that does not mean I feel that my current role is superior to any other data scientist role out there. Also, I work for a very large company with lots of resources, so I also want to point out that the roles I will describe below can overlap depending on your working environment.
Academic/Research Data Scientist
These are the people who design new machine learning algorithms and push the boundaries of data science and AI. When you see advances in self driving cars and computer vision, these are the people behind those advances. These individuals work either in a university setting or as part of a research team for companies like Google, Facebook, Tesla. Most either hold a PhD or are currently working on one. These data scientists actively develop and conduct research experiments that are written up and published in scientific journals. These are the pure scientists among the data science world.
To be amongst this crowd of data scientists, you need to be at the top of your game with advanced mathematics and programming skills. If you really love diving deep into the field and can handle the often glacial pace research moves at, this could be the job for you. The biggest drawback is that these jobs are limited. There are only so many academic or industry research positions out there. Most data scientists today instead fall into the other two categories.
Applied Data Scientist
Applied Data Scientists are a bit more pragmatic. They work for a company that drives their goals, instead of being funded by research grants. They do not have the luxury of time often afforded those working on grants, so the solutions they build need to go into production sooner rather than later. (Now to be fair to researchers, applied data scientists also don’t have to deal with the headaches surrounding grant proposals).
Typically, data scientists working in industry (not part of a research team) are not out developing new algorithms or trying to push the limits of machine learning. Instead, they use tools created by others to explore and derive meaning from data that can be acted upon. When the boss wants actionable data and they need it now. Most applied data scientists keep a few algorithms on hand that they know work for certain scenarios and spend most of their time gathering, cleaning, and prepping the data to build out the models.
I kind of like this position. I view myself more of an applied scientist. Even while going through my PhD, I always leaned towards applied versus theoretical.
To work as an applied data scientist, a candidate should have a master’s degree or at least 6 years industry experience. They should be inquisitive and honestly interested in the domain in which they work in. I work in cyber security, I have spent a lot of time researching and studying the field so I can identify opportunities to provide a data driven solution. Candidates should also have a wide ranging skill set beyond just ML. An applied data scientist should be well versed in tools such as dashboard development, optimization modeling, forecasting, and simulation modeling.
Data Analyst/Scientist
This is probably the most common data science position right now. What this position is calling for is basically a top level analyst familiar with data science tools. Now I am not denigrating this positon. What these data scientists do is every bit as challenging and important as the other two I described above. They are expected to operate as a data scientist while also handling analyst or business intelligence duties as well.
People in this position are not less than or incapable of doing the other roles described above, they are instead part of an organization that either does not have a fully developed data science program or they are working outside the data science organization. These data scientists are often embedded in a department providing data management and analysis expertise. Truly jacks of all trades, these data scientist often stand-up and manage data warehouses or data marts for their department. They can be expected to handle reporting duties as well as machine learning model development.
Conclusion
To sum this all up, data science is a broad and still evolving field. Solid industry definitions are not common place and titles often do not represent actual job duties. However, most data scientists can be generalized under one of the three roles I discussed above: Academic/Research Data Scientist, Applied Data Scientist, or Data Analysts/Scientists. Neither role is inherently better or more important, but the differences in the rows can definitely attract different individuals.
Here is a code block to create a database if you want to play along
create database sandbox;

use sandbox;
CREATE TABLE employee_id (
        emp_nm varchar(30) not null,
        emp_id varchar(8),
        b_emp_id varchar(8),
        PRIMARY KEY(emp_nm) );
While loading data from Excel files and CVS files is pretty straightforward in Python, getting database from a SQL database is really a skill you should learn. SQL databases can store much more data than an Excel file and are used pretty much everywhere now.
This lesson will focus on MySQL, I have another lesson for SQL Server as well. The syntax does vary a little and if you are working with Oracle or Teradata, your syntax may change a bit as well. Luckily the Internet has plenty of resources to point you in the right direction.
Now, for MySQL, lets get started. First you are going to want to install mysql.connector (if you have the Anaconda distribution that I recommend, it comes with this pre-installed.
If you don’t have it installed, you can get it using pip or conda – I have a video showing you how to install a module here: video link — skip ahead to the 7 minute mark where I explain how to install modules
Once install, import it into your notebook
Now lets make a connection to our server: syntax should be self explanatory – localhost simply means its installed on my computer — otherwise you would provide a network path to the server there.
Let’s start by looking around- First I want a name off all the databases in my instance
Now in this example we will be working with the Sandbox database — I provided code at the top of the lesson you can paste and run in your MySQL instance to create a Sandbox database
Now lets add a new element to our connection string – database
And query the table names in the Sandbox database
Using the .execute() method, we can pass SQL commands to the MySQL instance
Below I am creating a table -> passing data to the table -> and committing the data
Without the commit() command, the data will not be saved into the table.
To add multiple rows to the table, I can use the executemany() method
Now let’s query our table. Note the .fetchall() method — this brings in all the rows from the query. I can iterate through list by running a simple for loop
I can also use the command .column_names after my cursor to return the column names of the last table I queried
Finally, we can use Pandas to put this database table into a dataframe we can work with