
At first blush, a dataframe looks a lot like a matrix. The big difference between the two is that all columns in a matrix must contain the same data type. This is not so with dataframes.
Download the csv file here: boxplot2
Load the data in R
df <- read.csv(file.choose())
head(df)

read.csv() automatically loads the file data into a dataframe. So without having to do anything else, we have a dataframe.
You call on data in a dataframe just like you do with a matrix.
df[1,]
df[,1]

Using the structure function, str(), we get a look at how R configured our dataframe
str(df)

str(df) tells us we have 1861 objects of 4 variables. – this means 1861 rows with 4 columns each.
It then goes on to identify the columns and their data. Note the Employee column. Instead of an integer like the other columns, Employee is classified as a Factor with 5 levels – meaning there are 5 unique names in this data set.
summary(df)
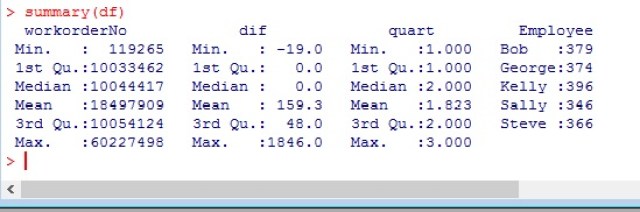
summary() gives you basic stats (min, 1st Quantile, Mean, Median,…) on your numeric columns. But with the Employee column it gives you the unique names in column and a count of how often they are used.
