Python: K Means Clustering Part 2

In part 2 we are going focus on checking our assumptions. So far we have learned how to perform a K Means Cluster. When running a K Means Cluster, you first have to choose how many clusters you want. But what is the optimal number of clusters? This is  the “art” part of an algorithm like this.

One thing you can do is check the distance from you points to the cluster center. We can measure this using the interia_ function from scikit learn.

Let’s start by building our K Means Cluster:
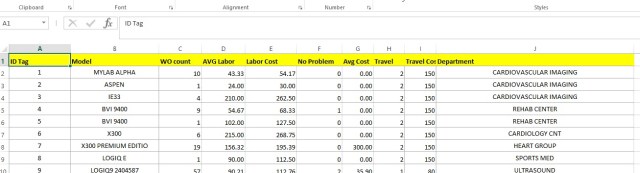
Import the data

import pandas as pd

df = pd.read_excel("C:\Users\Benjamin\Documents\KMeans1.xlsx")
df.head()

kmeans1

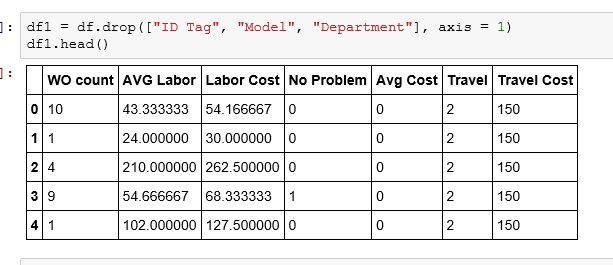
Drop unneeded columns

df1 = df.drop(["ID Tag", "Model", "Department"], axis = 1)
df1.head()

kmeans2

Create the model – here I set clusters to 4

from sklearn.cluster import KMeans
km = KMeans(n_clusters=4, init='k-means++', n_init=10)

Now fit the model and run the interia_ function

km.fit(df1)
km.inertia_

kmeaninter.jpg

Now the answer you get is the sum of distances from your sample points to the cluster center.

What does the number mean? Well, on its own, not much. What you need to do is look at a list of interia_ for a range of cluster choices.

To do so, I am set up a for loop.

n = int(raw_input("Enter Starting Cluster: "))
n1 = int(raw_input("Enter Ending Cluster: "))
for i in range(n,n1):
 km = KMeans(n_clusters=i, init='k-means++', n_init=10)
 km.fit(df1)
 print i, km.inertia_

kmeaninter1.jpg

The trick to reading the results is look for the point of diminishing returns. The area I am pointing to with the arrow is where I would look. The changes in values start slowing down here.

I am using this example because I feel it is more real world. Working with real data takes time to a get a feeling for. If you are having trouble seeing why I chose this point, consider the following textbook example:

See how at this highlight part, the drop in number goes from hundreds to 25. That is a diminished return. The new result is not that much better than the earlier result. As opposed to 1 and 2 where 2 clusters perform 1000 units better.

kmeaninter2.jpg


Python: K Means Cluster

K Means Cluster will be our introduction to Unsupervised Machine Learning. What is Unsupervised Machine Learning exactly? Well, the simplest explanation I can offer is that unlike supervised where our data set contains a result, unsupervised does not.

Think of a simple regression where I have the square footage and selling prices (result) of 100 houses. Taking that data, I can easily create a prediction model that will predict the selling price of a house based off of square footage. – This is supervised machine learning

Now, take a data set containing 100 houses with the following data: square footage, house style, garage/no garage, but no selling price. We can’t create a prediction model since we have no knowledge of prices, but we can group the houses together based on commonalities. These groupings (clusters) can be used to gain knowledge of your data set.

I think seeing it in action will help.

If you want to play along, download the data set here: KMeans1

The data set contains a 1 year repair history of 197 Ultrasound medical devices.

Data dictionary (ID Tag – asset number assigned device, Model – model name of device, WO Count – count of repair work orders, AVG Labor – average labor minutes per repair, Labor Cost – average labor cost per repair, No Problem-  count of repairs where no problem was found, Avg Cost -average cost of parts, Travel – average travel hours per repair, Travel Cost – average travel cost per repair, Department – department that owns the ultrasound device)

kmeans

We want to see what kind of information we can extract from this data.

To do so, we are going to use K Means Clustering.

How does K Means Clustering work? Each row in the table is converted to a vector. Imagine the vectors now graphed in N-dimension space. Next pick the number of clusters you want to create. For each cluster, you will place a  point(a centroid) in space and the vectors are grouped based on their proximity to their nearest centroid.

The calculation to tell proximity is made using geometric means (not arithmetic)- hence the name K-Means Cluster

(each dot below is a row in your table, the colors represent a cluster)

kmeans2

Let’s do it in Python

Import the data.

import pandas as pd

df = pd.read_excel("C:\Users\Benjamin\Documents\KMeans1.xlsx")
df.head()

kmeans1

Now, we are going to drop a few columns: ID Tag – is a random number, has no value in clustering. Then Model and Department,as they are text and while there are ways to work with the text, it is more complicated so for now, we are just going to drop the columns

df1 = df.drop(["ID Tag", "Model", "Department"], axis = 1)
df1.head()

kmeans2

Now lets import KMeans from sklearn.cluster

We then initialize KMeans (n_clusters= 4 -no of clusters you want, init=’k-means++’ -sets how the centroids are places. k-means++ is one of the faster methods of centroid placement, n_init=10 – number times the algorithm with run placing new centroids each iteration)

from sklearn.cluster import KMeans
km = KMeans(n_clusters=4, init='k-means++', n_init=10)

kmeans3.jpg

Choosing number of clusters is a bit of an art. Play with it a bit and see how different values play out for you.

Now fit the model

km.fit(df1)

kmeans4.jpg

Now, export the cluster identifiers to a list. Notice my values are 0 -3. One value for each cluster.

x = km.fit_predict(df1)
x

kmeans5.jpg

Create a new column on the original dataframe called Cluster and place your results (x) in that column

df["Cluster"]= x
df.head()

kmeans6.jpg

Sort your dataframe by cluster

df1 = df.sort(['Cluster'])
df1

kmeans7.jpg

Now as you start to examine the data in each cluster, you show start to see patterns emerge.

Below is an example of the patterns I found in the clusters.

kmeans9.jpg

Now remember, this is just an INTRODUCTION to unsupervised learning. We will learn more tricks to help you discover the patterns as we move forward.